Finland has been pumping more money into the EU than it has received, 9 out of ten years, from 2000 – 2010.
Which countries are net contributors to the EU budget?
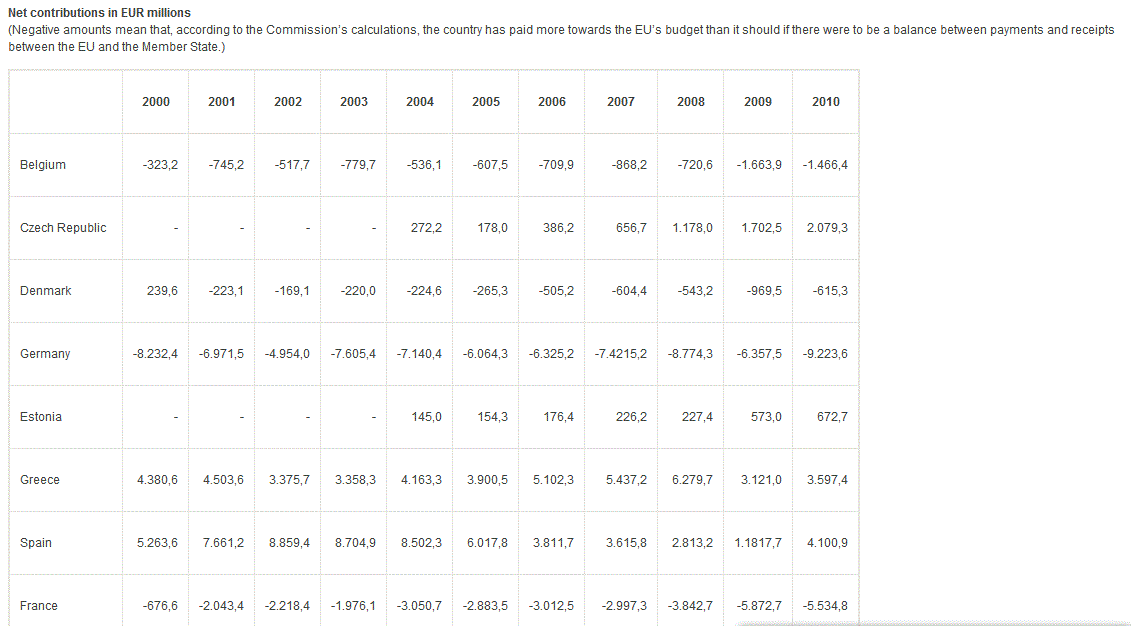
The table shows Member States’ net contributions to the EU’s annual budget for the period from 2000 to 2010. The list has been compiled by the Commission, and it should be noted that the list of which countries are net contributors or net beneficiaries can be calculated differently with other amounts as the result.
The Commission’s list of net contributions is based on a method which uses the individual countries’ contributions in the form of own resources, such as VAT and GNP, as the basis for the calculations. Agricultural levies and customs duties are not included as contributions because they are not regarded as country-specific contributions. Administration costs are not included in the list on the expenditure side.
First, the extent of the individual country’s contribution of VAT and GNP as a percentage share of the total contribution of VAT and GNP is calculated. The resulting percentage is used to calculate the amount the Member State should receive from the EU if there were to be a balance between payments and receipts between the Member State and the EU. If, for example, a country’s contribution amounts to 7% of the total contributions, the country should also receive an amount which corresponds to 7% of the EU’s total payments. The net contribution is then calculated by looking at the amount the country actually receives from the EU, from which is deducted the amount the Member State should receive according to the above. Finally, the individual country’s contribution to the financing of the British rebate is also deducted.
It should be noted that if the figure that results from the above calculation is negative, it means that the country has received fewer payments from the EU than it should and is therefore, according to the above model, a net contributor to the EU’s budget.
Net contributions in EUR millions (Negative amounts mean that, according to the Commission’s calculations, the country has paid more towards the EU’s budget than it should if there were to be a balance between payments and receipts between the EU and the Member State.)
Finland 275,9 -153,0 -4,9 -26,7 -69,6 -84,8 -241,0 -171,6 -318,5 -544, -300,2


If I understand the figures correctly, there would seem to have been a brief “honeymoon” period in the first year of this wretched experiment.
Every year after, though, Finland has been a net loser.
The honeymoon period when everything was rosy and lovey/dovey has gone sour.
Frankly, one would have thought the Finns had more sense than to tie themselves to this ugly monster.
In the fifties, Finnish children were taught that the map of Finland looked like the Finnish maiden looking anxiously over her shoulder at the Russian bear in the East.
Now it would seem more appropriate to focus on the South and West where the dough is being wasted.
Time to cut loose from this dysfunctional beast I would think.